
Article
Configure Xdebug in VS Code
Install the PHP debug adapter and create reliable launch and path mapping settings.

Install the two separate pieces
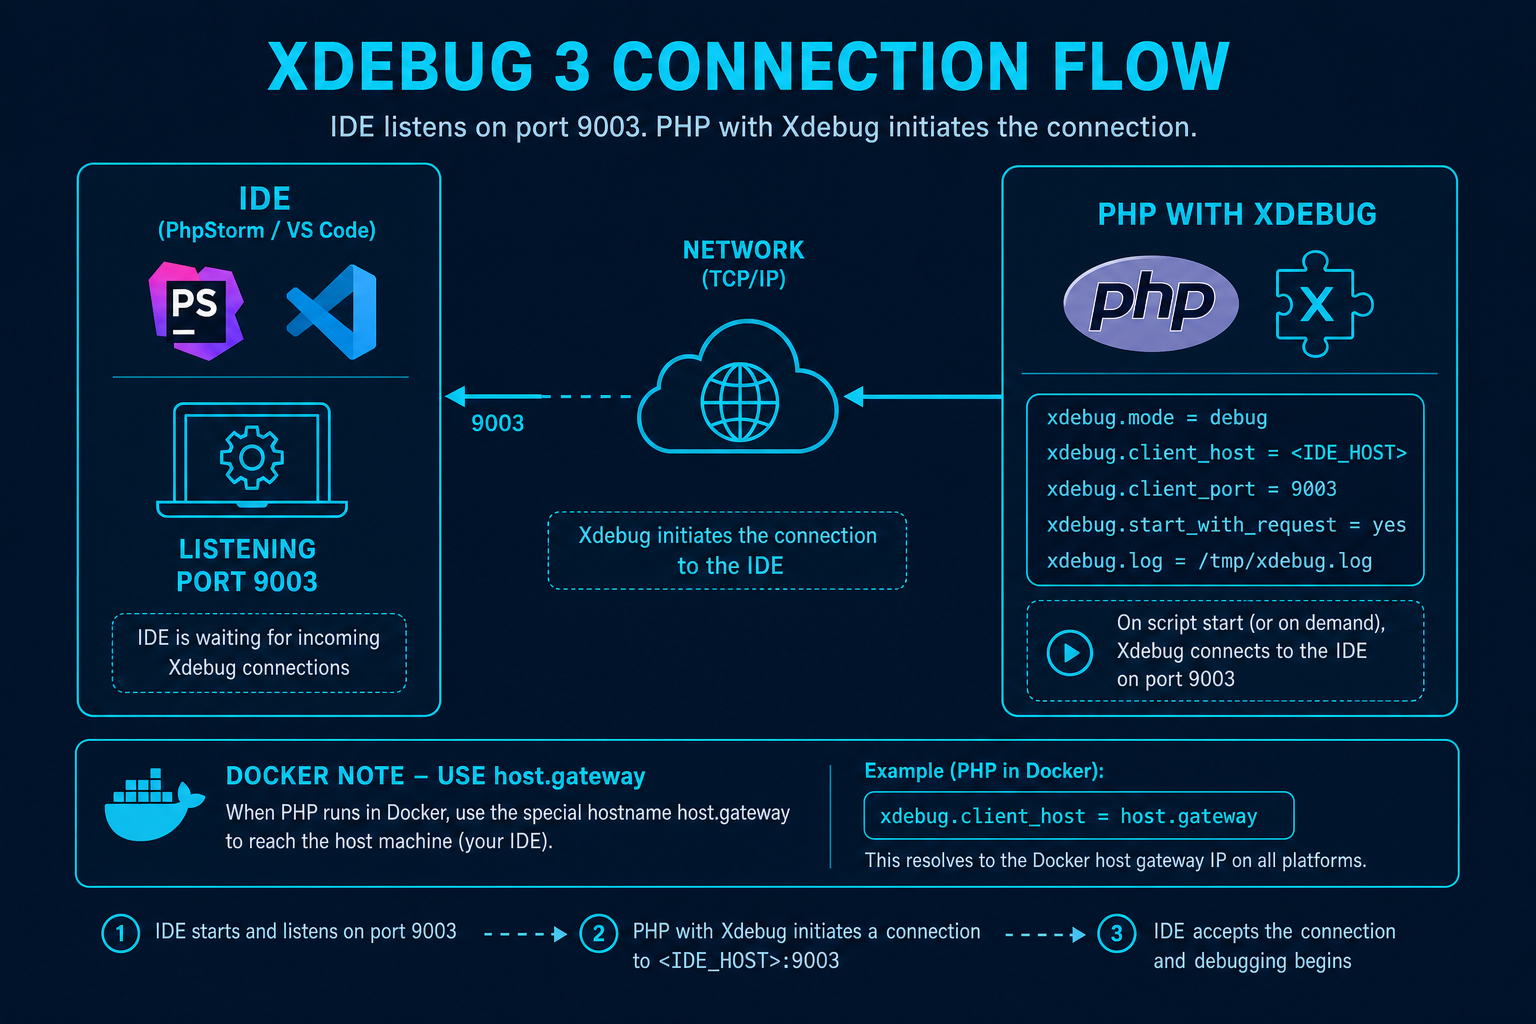
Xdebug is a PHP extension running with PHP. VS Code requires a compatible PHP Debug marketplace extension to act as the client. Installing only one cannot produce a debug session. Verify the publisher and current extension documentation before rollout.
Create launch configuration
Add a listen configuration in .vscode/launch.json, normally using port 9003 for Xdebug 3. Add pathMappings for Docker or remote server roots. Keep user-specific paths out of shared settings when possible and never commit secrets.
Check the active SAPI
php --ini reports CLI configuration, while web requests may use FPM or Apache configuration. Confirm Xdebug in the same SAPI that handles the failing request. Use trigger mode to avoid slowing every request.
Troubleshoot systematically
Start the listener, trigger a minimal script, inspect Xdebug’s diagnostic log, and compare the incoming filename to path mappings. Once that works, debug the application route or PHPUnit target. Randomly changing ports obscures the real cause.
Verification and maintenance
Configure Xdebug in VS Code was reviewed for this seed on 2026-08-09. Before adopting its recommendations, confirm current releases, platform support, licensing, extension publishers, and configuration syntax through Visual Studio Code PHP Documentation at the official source linked below. Product status and plugin compatibility can change independently of this editorial record.
Test changes on a representative repository and keep Composer scripts, automated tests, static analysis, and version control authoritative. If official documentation no longer supports a claim made on /ide/vscode/xdebug/, mark the fact unknown or update it from a primary source rather than filling the gap from an old tutorial or download mirror.
Related reading
- Best PHP IDEs and Editors in 2026 A requirements-led shortlist of current PHP IDEs and editors, with conservative feature claims.
- Best Free PHP IDEs and Editors Compare genuinely useful no-cost PHP environments without treating plugin-based support as built in.
- PHP IDEs for Windows Current Windows PHP choices for native, WSL, Docker, and remote workflows.
- PHP IDEs for Linux Choose a PHP environment for local Linux, containers, SSH servers, and low-resource desktops.
- PHP IDEs for macOS Select a PHP editor on macOS with attention to Apple Silicon, local runtimes, containers, and remote work.