
PHP error category
Xdebug
Xdebug diagnostics.
Xdebug errors arise when xdebug diagnostics affect an executing PHP application or its supporting service. Use the exact signature and runtime context to narrow the cause before changing configuration.
The guides in this category separate code defects from environment differences, show focused diagnostics, and favor site-scoped corrections that preserve unrelated applications.
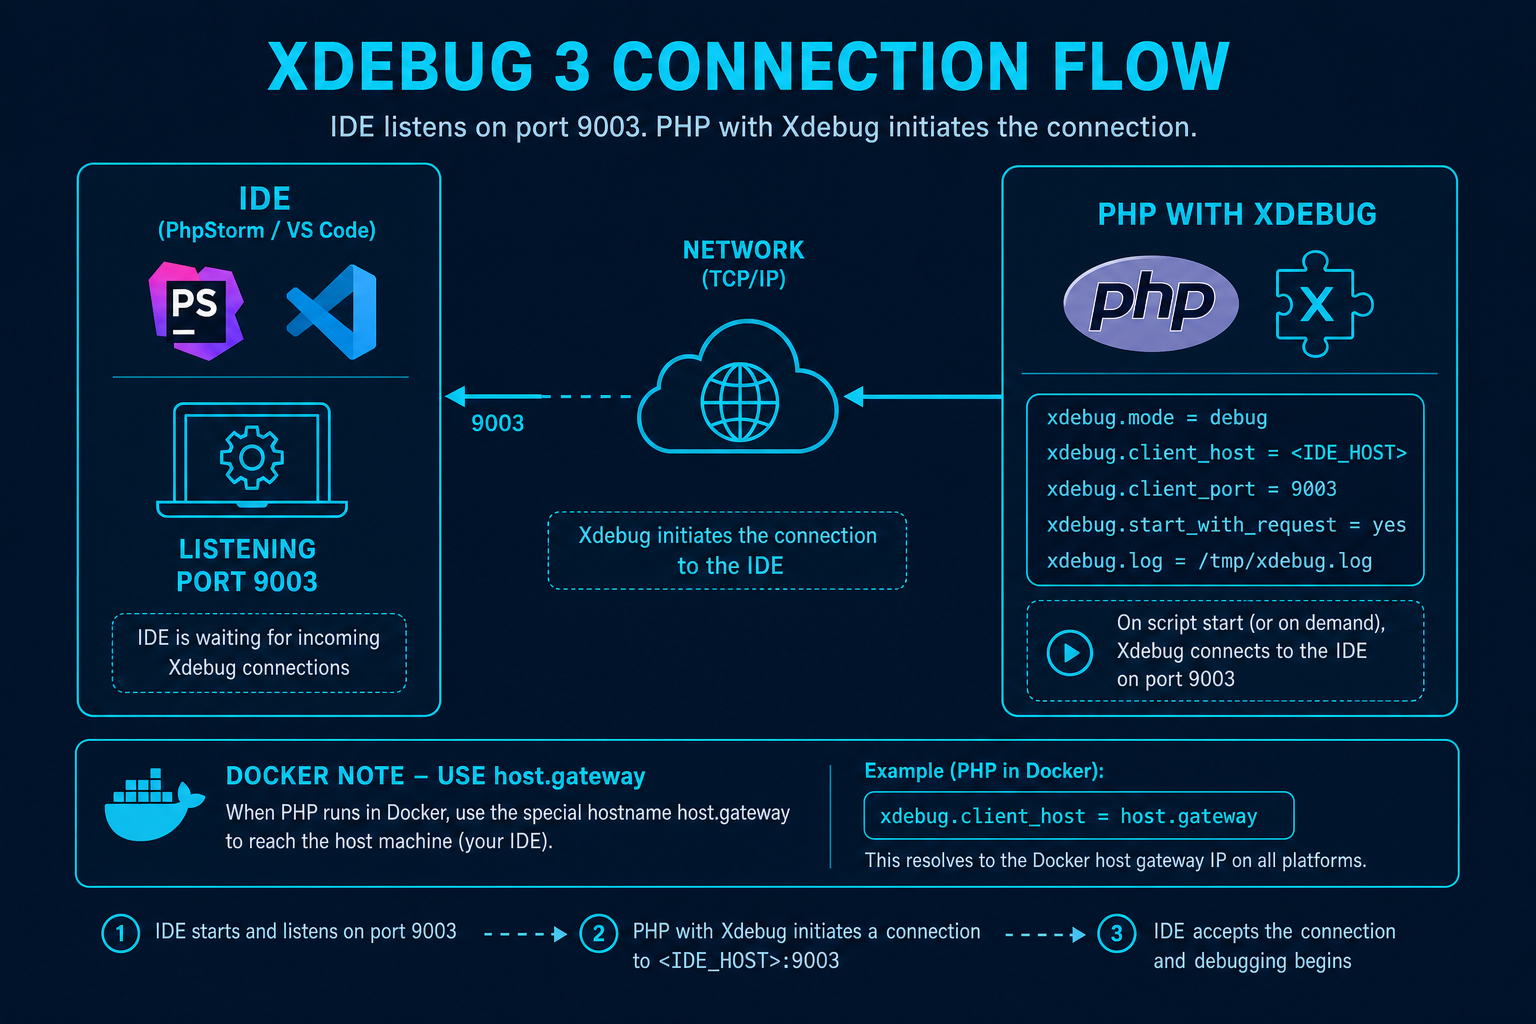
Guides in this category
| Title | Pattern | Severity |
|---|---|---|
| Xdebug already loaded | Cannot load Xdebug - it was already loaded |
warning |
| Xdebug could not connect to debugging client | Xdebug: [Step Debug] Could not connect to debugging client. Tried: %s:%d |
warning |
| Xdebug Docker client host unreachable | Xdebug: [Step Debug] Could not connect to debugging client. Tried: localhost:%d |
warning |
| Xdebug invalid mode | Xdebug: [Config] Invalid mode 'debugger' set for 'xdebug.mode' configuration setting |
warning |
| Xdebug legacy port 9000 mismatch | Xdebug: [Step Debug] Could not connect to debugging client. Tried: %s:9000 |
warning |
| Xdebug log permission denied | Xdebug: [Log Files] File '/var/log/xdebug.log' could not be opened. |
warning |
| Xdebug maximum function nesting level reached | Fatal error: Maximum function nesting level of '256' reached, aborting! |
fatal |
| Xdebug profiler output could not be opened | Xdebug: [Profiler] File '/tmp/cachegrind.out.123' could not be opened. |
warning |
| Xdebug trace file could not be opened | Xdebug: [Tracing] File '/traces/trace.123.xt' could not be opened. |
warning |